


30+
Years of Servicesince 1994
 Advancing SDG-ESG Excellence for a Greener, Inclusive, and Resilient Future
Annual Carbon Emission Report
The UMS Carbon Emission Report showcases the university’s yearly progress in environmental stewardship, social responsibility, and governance excellence. As a leading EcoCampus and a model for sustainable higher education in Malaysia and Borneo, this report highlights UMS’s achievements, challenges, and forward strategies in driving a holistic and integrated SDG-ESG agenda across campus operations, academic programmes, research innovation, and community engagement.
Towards Net Zero Emissions 2035
UMS Carbon Footprint Assessment Tool (CFAT)
Universiti Malaysia Sabah (UMS) has demonstrated a sustained commitment to low-carbon development and net-zero commitment since 2013 , advancing its institutional sustainability agenda through the implementation of a structured carbon management system and a Net Zero Emissions Target by 2035 . To operationalize this commitment, UMS has established the Carbon Footprint Assessment Tool (CFAT) as the university’s official platform for measuring, monitoring, and reporting greenhouse gas (GHG) emissions.
Alignment with International Standards
The UMS Carbon Footprint Assessment Tool (CFAT) is developed in alignment with internationally recognized carbon accounting frameworks, primarily the Greenhouse Gas (GHG) Protocol Corporate Standard , and is further guided by the UI GreenMetric Guidelines to ensure consistency with global higher education sustainability benchmarking. In operationalizing this framework, UMS adopts standardized methodologies for greenhouse gas (GHG) quantification , including the use of activity-based calculations supported by verified emission factors (EFs) expressed in CO₂ equivalent (CO₂e) per unit of activity. Emission factors applied within CFAT are referenced from authoritative international and national sources , including the Intergovernmental Panel on Climate Change (IPCC), United Nations Framework Convention on Climate Change (UNFCCC), and other recognized databases such as EPA and DEFRA, while also incorporating Malaysia-specific electricity grid emission factors to ensure contextual accuracy. The calculation approach follows established steps, including defining system boundaries, identifying relevant GHGs and their global warming potential (GWP), and applying sector-specific emission factors based on energy consumption and operational activities. This alignment ensures that carbon emissions reporting at UMS is methodologically robust, transparent, and internationally comparable , while remaining locally relevant and verifiable. As a result, CFAT supports not only internal performance monitoring and policy development but also external reporting requirements, including QS Sustainability Rankings and UI GreenMetric assessments, thereby strengthening UMS’s position within global sustainability benchmarking frameworks.
Scope of Carbon Emissions
UMS adopts a structured and data-driven approach to carbon emissions assessment, beginning with a comprehensive inventory of energy use and greenhouse gas (GHG) emissions across campus operations. The university systematically measures electricity consumption and transportation-related activities, supported by operational data collection and periodic monitoring of energy performance indicators. This enables the identification of emission hotspots and supports the development of targeted carbon reduction strategies. Currently, UMS reports emissions under the following scopes in alignment with the Greenhouse Gas (GHG) Protocol :- Scope 1 – Direct Emissions Emissions from university-controlled sources, primarily campus transportation, including university-managed and registered vehicles.
- Scope 2 – Indirect Emissions Emissions from purchased electricity consumption across academic, administrative, and residential facilities.
UMS’s Carbon-Management Process
UMS’s approach to upgrading existing buildings is guided by MS 1525:2014 – Energy Efficiency and Use of Renewable Energy in Non-Residential Buildings, which sets requirements for building envelope improvements, HVAC optimisation, artificial lighting efficiency, and renewable-energy integration. UMS has adopted MS 1525 as the baseline standard for all new retrofitting projects and building upgrades carried out under the ECCMC. UMS implements a structured five-step carbon-management cycle aligned with national and international standards, including MS 1525:2014, ISO 14001:2015, and government energy-efficiency guidelines. This cycle ensures that carbon reduction is systematic, data-driven, and continuously improved across all campus operations.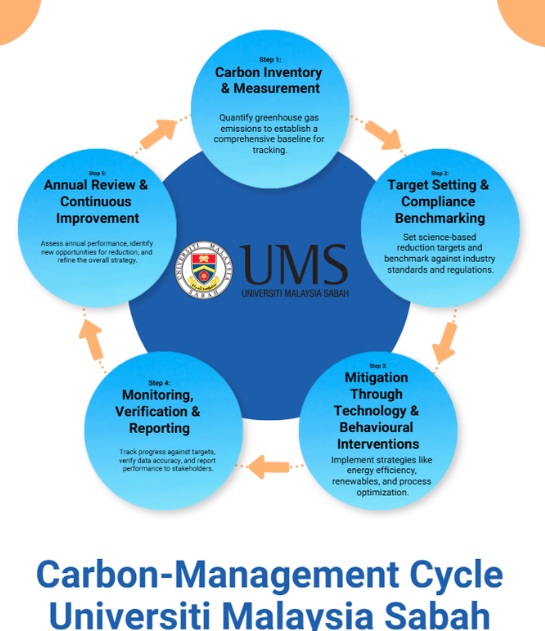
1. Carbon Inventory and Measurement
UMS begins its process with a comprehensive inventory of energy use and carbon emissions. The university measures electricity consumption, fuel usage, and building performance through smart metering installed at high-consumption buildings and monthly tracking of electricity intensity (kWh/m²/year). Scope 1 and Scope 2 emissions are fully monitored, with partial monitoring of Scope 3 sources. Data is harmonised with DOE Sabah and LAKSANA/MOF for state-level environmental reporting. This robust baseline establishes the foundation for identifying emission hotspots and planning targeted reduction strategies.2. Target Setting and Compliance Benchmarking
UMS adopts clear and measurable emission-reduction targets guided by MS 1525:2014 performance indicators, the ISO 14001 continual-improvement framework, and national energy-transition policies such as the National Energy Transition Roadmap (NETR). Internal commitments include reducing emissions by 10–20% from the 2017 baseline and securing annual efficiency improvements of 3–5%. These benchmarks define carbon-reduction pathways for existing buildings, campus operations, and upcoming infrastructure projects.3. Mitigation Through Technology and Behavioural Interventions
Carbon mitigation at UMS is achieved through a combination of technological upgrades and behavioural change programmes. Key measures include LED lighting retrofits, HVAC and chiller optimisation, and the procurement of high-efficiency appliances under the Government Green Procurement (GGP) Policy. A major milestone is the RM45.05 million Sunview EPCC 10.5 MWp solar PV project (2025), which will reduce grid-based emissions by up to 30%. UMS also integrates green-building features—such as natural ventilation and daylighting atriums—during renovation works. Staff and students are empowered through low-carbon behavioural programmes, including EcoCampus campaigns, SULAM modules, and Mobility Reduction Plans. Collectively, these actions significantly lower electricity use and fuel consumption across campus.4. Monitoring, Verification, and Reporting
UMS maintains rigorous oversight of its carbon-management activities. Carbon and energy data are monitored monthly by the Development of Maintenance office (Jabatan Pembangunan dan Penyelenggaraan, JPP) Energy Division, while the ECocampus Management conducts quarterly reviews to identify anomalies, assess progress, and verify reductions. Annual carbon-performance reports are submitted to university leadership, DOE Sabah, and relevant state committees. Real-time energy dashboards enable early detection of consumption spikes and inefficiencies, allowing for timely corrective action and continuous optimisation of energy use.5. Annual Review and Continuous Improvement
In alignment with the ISO 14001 management cycle, UMS conducts an annual review of its carbon-management performance. This review includes re-evaluating reduction targets, updating mitigation strategies, and integrating emerging technologies such as AI-based monitoring, expanded BEMS coverage, and microgrid systems. The university also identifies new high-impact projects for the coming year to strengthen its carbon-reduction agenda. This continuous-improvement approach ensures that UMS’s decarbonisation pathway remains dynamic, measurable, and aligned with its long-term vision of achieving a Low-Carbon and Net-Zero Campus by 2035.From Measurement to Mitigation — A Structured Path to Net-Zero 2035.
UMS Carbon Emission Report
This report presents the carbon emissions profile of Universiti Malaysia Sabah (UMS) for year 2025 and compared with previous year data. The purpose of this report is to quantify greenhouse gas (GHG) emissions and support the university’s commitment toward sustainability. The reporting framework aligns with internationally recognized standards and guideline such as the Greenhouse Gas Protocol Standard and UI GreenMatrix Guideline. The following calculation of Greenhouse Gases (GHG) for Universiti Malaysia Sabah covers the Scope:
- • Scope 1 (Direct Emissions) Emissions from vehicles
- • Scope 2 (Indirect Emissions)) Emissions from purchased electricity
Scope 1 Emission: Transportation
The study calculated Universiti Malaysia Sabah (UMS)’s Scope 1 emissions for the year 2025 (January until December). This calculation involved vehicles travel inside campus including owned/managed by Development and Maintenance Department, Universiti Malaysia Sabah (JPP) and registered with the UMS Security Department. The total emissions for Scope 1 were calculated based on the following equation:Transportation Emission (tCO2) = Activity data x Emission Factor
Emission factor used: Bus (diesel) = 0.01 tCO2e/100 km Car (petrol) = 0.02 tCO2e/100 km Motorcycle (petrol) = 0.01 tCO2e/100 km Table 1. Carbon Emissions from Transportation at Universiti Malaysia Sabah, 2025| Type of Vehicle | Travel Distance in Year (km) | Total Emission (tCO₂) |
|---|---|---|
| Shuttle Bus (inside UMS) - Diesel | 162,240 | 16.22 |
| Car - Petrol | 2,586,240 | 517.25 |
| Motorcycle - Petrol | 1,680 | 40.32 |
| Total Carbon Emission | 573.79 | |
| Type of Vehicles | Total Emission (tCO₂e) | ||
|---|---|---|---|
| 2025 | 2024 | 2023 | |
| Shuttle Bus (inside UMS) - Diesel | 16.22 | 16.22 | 16.22 |
| Car - Petrol | 517.25 | 518.02 | 518.02 |
| Motorcycle - Petrol | 40.32 | 40.32 | 13.63 |
| Total | 573.79 | 574.56 | 547.87 |
Scope 2 Emission: Electricity
The study calculated Universiti Malaysia Sabah (UMS)’s Scope 1 emissions for the year 2025 (January until December). This calculation involved vehicles travel inside campus including owned/managed by Development and Maintenance Department, Universiti Malaysia Sabah (JPP) and registered with the UMS Security Department. The total emissions for Scope 1 were calculated based on the following equation: The scope 2 emissions were calculated using electricity data of UMS obtained from January until December 2025. The calculation was referred to GHG Protocol Standard. The total emissions for Scope 2 were calculated based on the following equation: Emissions (kg CO2e) = Total kWh Consumed × Emission Factor (kg CO2e per kWh) The emission factor used for calculating energy emissions is 0.525 kgCO2e/kWh from Energy Commission (Sabah) in 2022. Table 3. Carbon Emissions from Electricity at Universiti Malaysia Sabah, 2025| Month | Electric Usage (kWh) | Carbon Emission (tCO₂e) |
|---|---|---|
| Jan | 3,873,222.00 | 2,033.44 |
| Feb | 3,669,381.00 | 1,926.43 |
| March | 3,007,113.00 | 1,578.73 |
| April | 2,774,949.00 | 1,456.85 |
| May | 3,520,426.00 | 1,848.22 |
| June | 3,817,440.00 | 2,004.16 |
| July | 3,962,036.00 | 2,080.07 |
| August | 3,783,049.00 | 1,986.10 |
| Sept | 3,346,810.00 | 1,757.08 |
| October | 3,068,475.00 | 1,610.95 |
| November | 3,995,750.00 | 2,097.77 |
| December | 3,898,740.00 | 2,046.84 |
| Total Carbon Emission | 42,717,391.00 | 22,426.63 |
| Year | 2025 | 2024 | 2023 |
|---|---|---|---|
| Total Carbon Emission (tCO2e) | 22,426.63 | 23,030.80 | 24,348.14 |
References
- 1. GHG Protocol Standard: https://ghgprotocol.org/sites/default/files/standards/ghg-protocol-revised.pdf
- 2. UI GreenMatrix Guidelines: https://uigreenmetric.com/resources/university/guidelines/2026/english
- 3. Electric Emission Factor: https://myenergystats.st.gov.my/documents/d/guest/grid-emission-factor-gef-in-malaysia
- 4. GHG reporting. Conventional factor 2023: https://www.gov.uk/government/publications/greenhouse-gas-reporting-conversion-factors-2023
- 5. EPA GHG Inventory Guidance: https://www.epa.gov/sites/default/files/2020-12/documents/mobileemissions.pdf